Are you a website owner, brand manager, or UX designer? Do you use heatmap tools for user analytics? If not, this article could be a reason why you should.
Here, we will cover heatmap tools, how they work, their usefulness, some credible heatmap tools, and whether they are GDPR-compliant.
What is a heatmap?
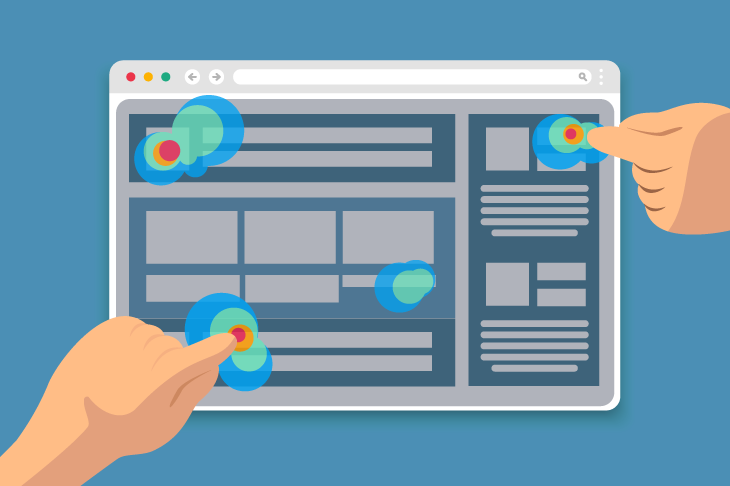
A heatmap is a website analytics tool that allows one to understand the visitor’s behavior on a website or app. It uses graphical representations of warm and cold colors.
Warm colors like red and yellow depict the areas on the website screen where users interact the most through scrolling, clicking, and just dwelling. Cooler colors like blue and green represent the lesser-focused areas that the users ignore while on your website.
A heatmap tool is used to generate such visualizations using your website data.
How do heatmap tools work?
In a traditional heatmap, the information is conveyed using colors rather than numerical values, making it easier to understand the insights.
Heatmaps collect website data and use heatmap tools to turn the data into easily decipherable information. Here are the most common types of heatmaps used on web pages:
1. Click heatmaps
Click heatmaps reveal the most clicked areas on a web page. The area where the user clicks the most will be depicted in red, while the least clicked area will be shown in a light or cooler color.
2. Scroll heatmaps
Scroll heatmaps reveal the part of the web page that is most scrolled to. The area where the user dwells the most after a scroll is depicted by bright colors, and lighter colors show the least scrolled areas.
3. Move heatmaps
Move heatmaps track the cursor’s movement when a user navigates the website. For instance, it may show dark areas around the main menu and main reading content area.
Why are heatmap tools useful?
Heatmap tools help make major decisions related to website changes. It helps in studying the user’s behavior, which in turn is helpful in multiple ways, like:
Website redesigning
If your website’s dwelling rate and conversion rates are below par, you may need to make some serious changes to your website design. Heatmaps can help you provide meaningful insights and gaps within your website design. You can thus use the data revealed from heatmaps to make crucial changes.
Content optimization
Heatmaps can also be useful in making some major SEO decisions. For instance, scroll heatmaps help us know the length of content users prefer to read. Click heatmaps will reveal if CTAs are properly positioned or if users click on CTAs like ‘you may also like to read’ and find the content relatable and useful. Such insights help make informed decisions.
Device optimization
Heatmaps are also useful in tracking the user’s behavior on different devices. The mobile heatmaps reveal the most interactive areas on the mobile interface. The same can be compared with desktop heatmaps to arrive at strange and important insights.
Top heatmap tools on the market
1. Hotjar
Hotjar is a popular name for heatmaps and behavior analytics tools. It provides hover-over heatmap analytics that helps you identify quick wins, pre- and post-launch behavior, user behavior across devices, user engagement patterns, and more.
It is GDPR-compliant and provides 365 days of storage with unlimited heatmaps under its free plan.
2. Mouseflow
Mouseflow is also a known behavior analytics and UX tool with a heatmap visualization tool.
It 100% records all the traffic for a year before analyzing user behavior through it. Mouseflow heatmap tool uncovers answers to six questions: where do users click? How far do users scroll? Which content increases conversion rates? What is the geographical location of the majority of users? What distracts from the user’s journey? And how users interact with web page menus and other elements.
Mouseflow offers a free plan limited to 500 recordings per month for a website with unlimited page views. The paid plans start at $31 per month and go up to $399 monthly.
3. Glassbox
Glassbox is a digital customer experience analytics tool known for its interactive heapmap analytics.
Instead of traditional heatmaps, it offers interactive maps that are more intuitive and insightful. These maps include A/B testing, user segmentation, zone analysis, side-by-side maps, exposure tracking, and AI-powered recommendations as some of their features.
Glassbox offers a composite pricing structure that takes care of all digital challenges. You can request the pricing for a specific feature as well.
4. Fullstory
Fullstory is a digital experience intelligence software that offers heatmaps as one of its many services.
The tool provides data analytics and explains the ‘why’ behind each user’s behavior pattern. It gives answers to some important questions that heatmaps are usually known for. Fullstory has a free plan that offers 10,000 sessions a month and one year of storage.
5. Smartlook
Heatmaps are an exclusive part of Smartlook’s (now part of CISCO) services. It offers three types of heatmaps: click, scroll, and movement. Smartlook claims to record 100% of user sessions and generate heatmaps with pre-existing data.
It also offers heatmaps for mobile apps. It does have a free plan with limited functionality that records 3000 monthly sessions. Unlimited heatmaps are provided in the pro and enterprise plans.
Heatmap tools and GDPR
All the heatmap tools mentioned above claim to be 100% GDPR-compliant. GDPR refers to the General Data Protection Regulation, which aims to protect users’ private data.
As using heatmaps requires recording user sessions, these tools must be GDPR-compliant and use the data recorded for only analytics purposes with user permissions.
A heatmap tool like Fullstory claims that it records only consent-based data, exports data, and excludes recording sensitive data per user requests.
Closing
Heatmaps are an integral method of understanding user behavior visually. They are useful for website owners, brand managers, software engineers, and web designers to understand users’ on-site behavior and use the data to make crucial changes within their strategic tasks.
These tools are helpful in A/B testing, increasing user engagement, and further optimizing the website to meet visitors’ needs.
If you haven’t done so already, it’s time to try a heatmap and leverage the power it gives you to upgrade your site or eShop!


Join the Discussion